How accurate is browser terrain, really?
Short answer: it depends where you point it. Waveshed reads elevation from a global composite. Most of the world resolves at about 30 m (NASA SRTM), but Britain is nearer 2 m, the United States about 10 m, with finer data again in several other countries. It models the bare ground, so it is a strong planning estimate, not survey grade. Here is what that really means, and how to go finer when you need to.
Where does the elevation come from?
Elevation comes from a global digital elevation model, the open Terrain Tiles dataset that AWS hosts for free. Waveshed reads the Terrarium-encoded tiles straight in your browser, decoding a height from the colour of each pixel. The set is built by the open-source Tilezen project, which grew out of Mapzen and now sits under the Linux Foundation, and it stitches open sources together by region. NASA SRTM is the backbone at about 30 m across most of the globe, and several countries drop much finer national data in on top. The full source list is on the accuracy page.
Each pixel carries its height in the colour channels: height = R × 256 + G + B/256 − 32768 metres. The format resolves to about four millimetres, so the encoding is never the weak link. Accuracy is about the spacing between real samples, and that spacing changes with where you are.
How good is it where you are?
Because the tiles blend national datasets over the SRTM backbone, the resolution you actually get depends on the country under your point:
- Great Britain is the finest, near 2 m over most of the country, from national LIDAR.
- The United States runs at about 10 m, dropping to 3 m in select areas, via USGS 3DEP.
- Norway and Austria sit around 10 m from their national models.
- New Zealand and coastal Australia land between about 5 and 8 m.
- The far north above 60° is roughly 5 m, where ArcticDEM fills the gap SRTM leaves.
- Most of the rest of the world is the 30 m SRTM baseline, coarsening to a few hundred metres or coarser only in the remotest high latitudes.
None of this beats what the browser tile grid serves at its finest, which is around 3 m. So the honest ceiling is a couple of metres in the best-mapped countries, and about 30 m across most of the map. The full per-country breakdown is in the dataset’s source list.
What does "30 metres" actually mean?
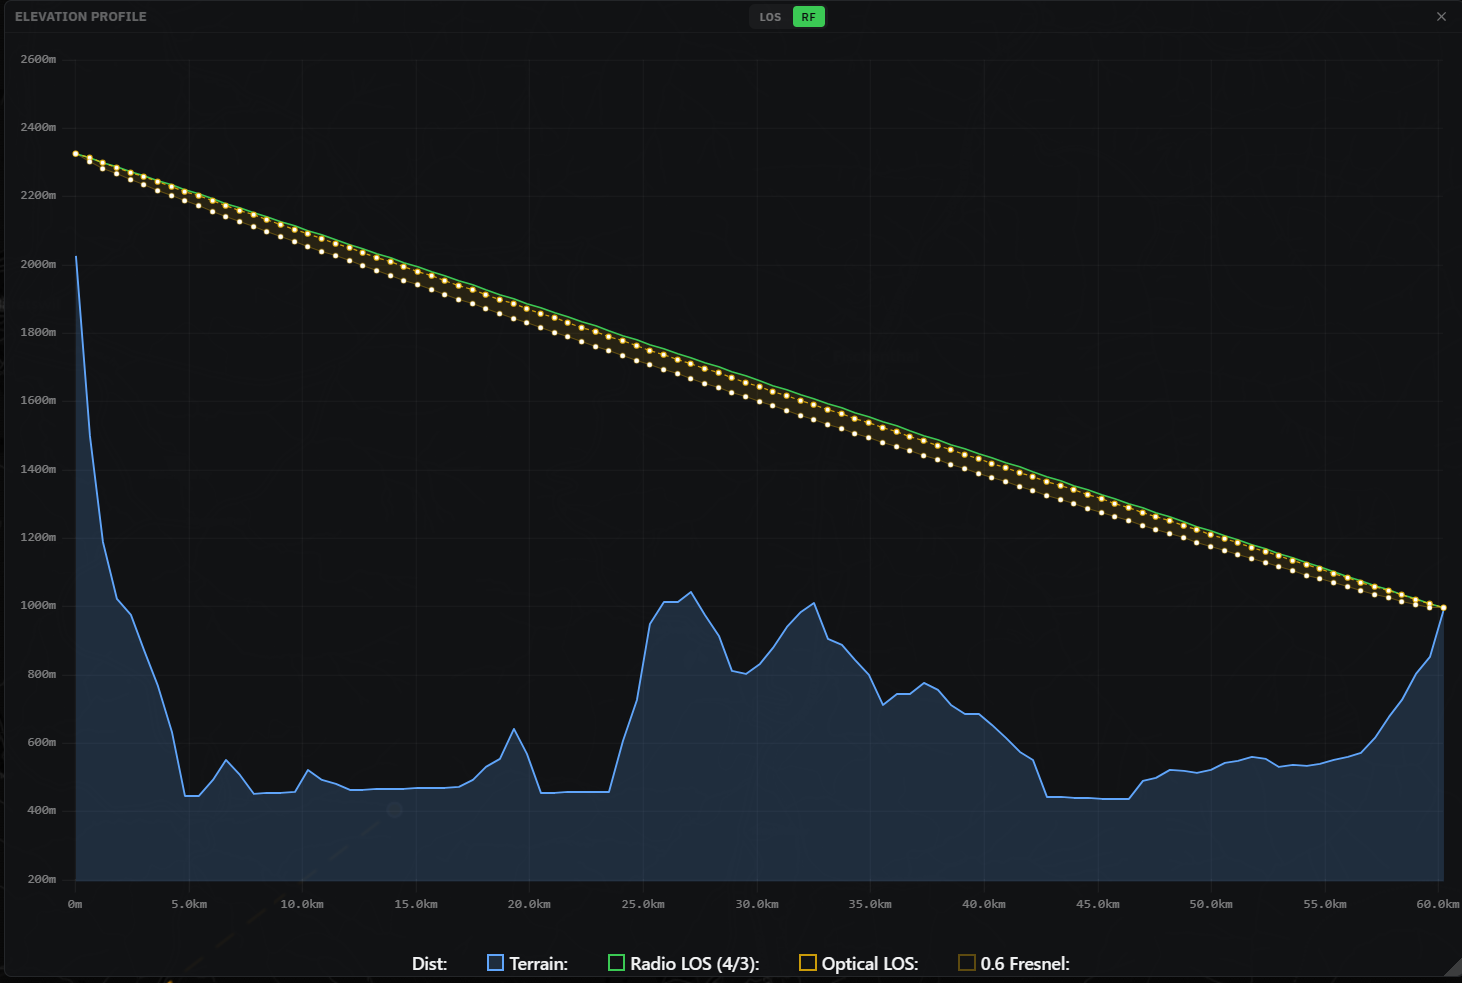
Where SRTM is the source, and that is most of the world, 30 m is the spacing between real elevation samples. One value for every 30 m or so of ground. A rock face, a narrow gully, or a ridge thinner than a football pitch can fall between two samples and never show up at all. Add a few metres of vertical error on top, more on steep slopes, and you have the honest picture.
Then why can I choose 3 m?
Because the setting is the analysis resolution, not the resolution of the data. It tells Waveshed how fine a grid to sample onto, and it can never add detail the source lacks. Over Britain a fine grid is backed by real 2 m data. Over SRTM ground the same setting just interpolates between 30 m samples, giving a smoother picture rather than more truth. Match the setting to the data under your point. How resolution, range and speed pull against each other is its own trade-off.
What the terrain leaves out
Waveshed works on the bare ground. Buildings, trees, foliage and street clutter are not part of the model. Neither are reflections, multipath, or weather effects like ducting. In towns and forests that can make coverage look optimistic. You can add building footprints by hand as solid obstructions, which is covered in working with buildings.
Need finer than the tiles? Bring your own terrain.
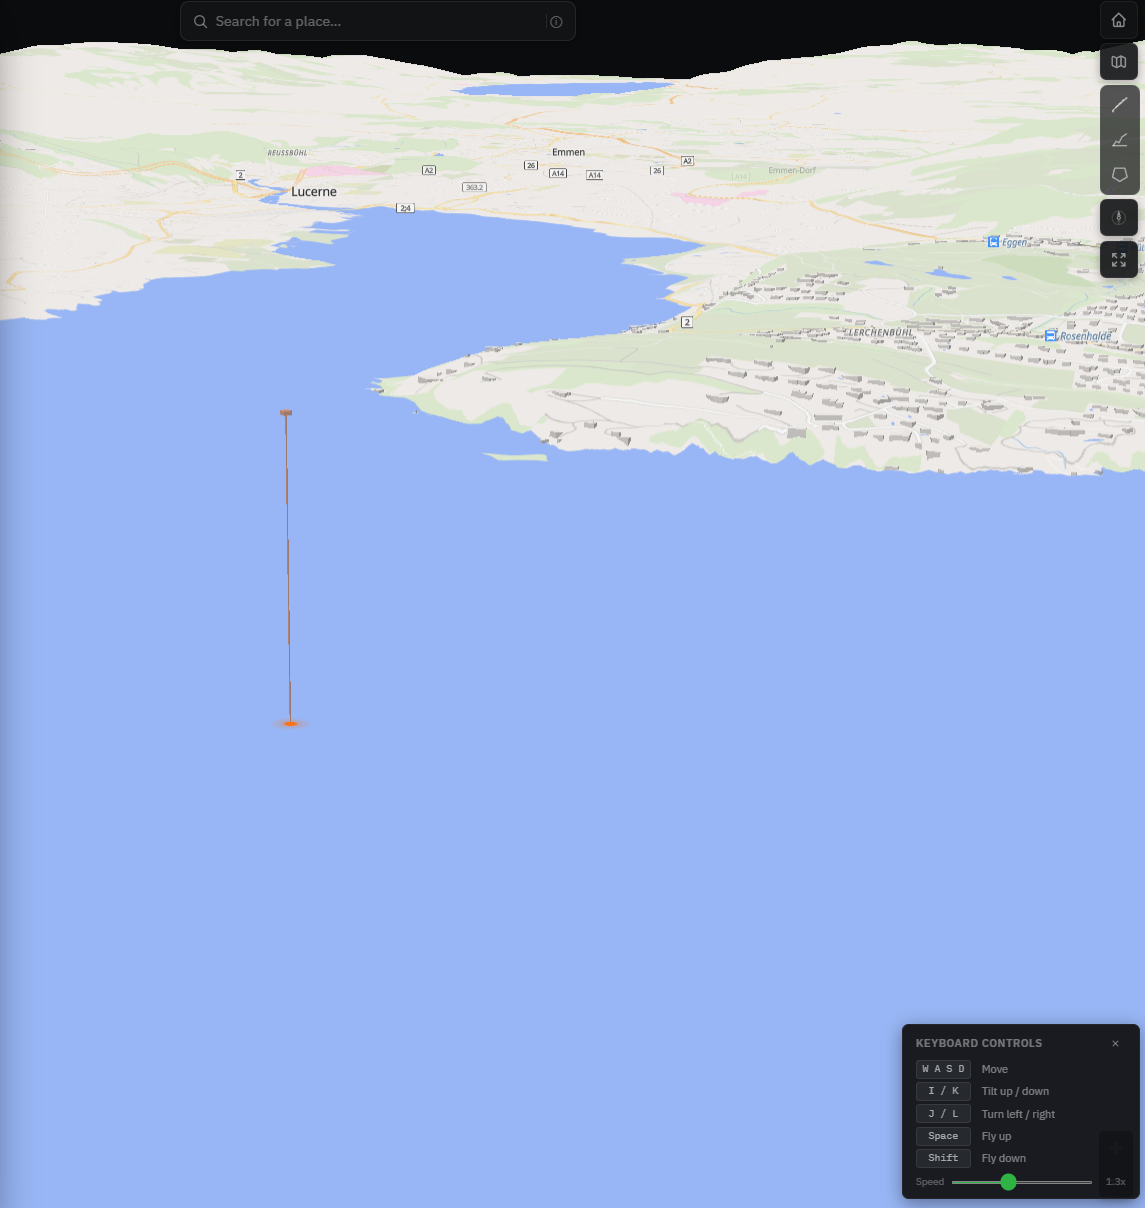
The browser is tuned for instant, no-setup planning, so it lives with the global tiles. When you need better, the planned QGIS plugin runs the same Aether engine on any elevation layer QGIS can load. That means national LIDAR, agency DEMs, or your own drone or survey data, down to a metre or two and finer. Same propagation model, your terrain, no global ceiling. It is on the roadmap rather than live yet.
So how far should you trust a result?
Trust it most where the ground is well mapped and terrain-limited, so open mountains, valleys and ridge lines, and above all in the countries with fine national data. Trust it least in the city, in dense forest, and on the last hundred metres into one specific building. Use it to compare sites, pick a mast height and rule out blocked paths. For which model answers which question, we pulled LOS and RF apart in a viewshed for radio. Then verify a critical link in the field.
Try it on ground you know
Pick a summit or a hill you know well, drop a point, and look at the profile. You will see straight away what the model catches and what it rounds off. It is free and runs in the browser. If summits are your thing, there is a whole guide on viewsheds for hikers.